What is a business dashboard? Your key numbers on one screen

In one sentence: A business dashboard is one screen that shows the handful of numbers that tell you how your business is doing today, and it updates by itself from the systems you already use.
Picture a scene most owners know. You want this month's sales figure. You ask the office. They ask accounts. Accounts pull it from one system, check it against a spreadsheet, and email it over two days later. By then it's out of date, and it doesn't match the number the sales team gave you.
A dashboard ends that. You open one screen and the number is there, already up to date.
This guide covers what goes on a dashboard, how it differs from a report, and how to get one without buying yet another system. If you'd rather skip ahead, tell us where the time goes and we'll reply in writing with a plan and a fixed price.
At a glance:
The job | The by-hand way | What happens now |
|---|---|---|
This month's sales figure | Ask two people, wait two days | Open one screen |
Are all our systems working? (ERTECH LTD) | Check each one by hand | One email every morning says what's working |
The weekly sales report (Stomp Distribution) | Pull the numbers together each week | Arrives by email every Monday |
Money owed to you | Scroll through the accounts | One number, updated as payments land |
What is a business dashboard?
It's one screen with the few numbers that matter most to your business. The numbers come from the systems you already use, and they update by themselves. You don't build it every week. You open it and look.
You'll also hear it called a KPI dashboard. KPI is short for key performance indicator, which is a grand name for "one of the numbers that tells you how you're doing". The Office for National Statistics even counts how firms use KPIs as one of the four things that make up its score for how well a business is run (ONS, checked 28-09-2026).
A financial dashboard is the same idea for money: cash, what you're owed and what you owe.
Which numbers should be on it?
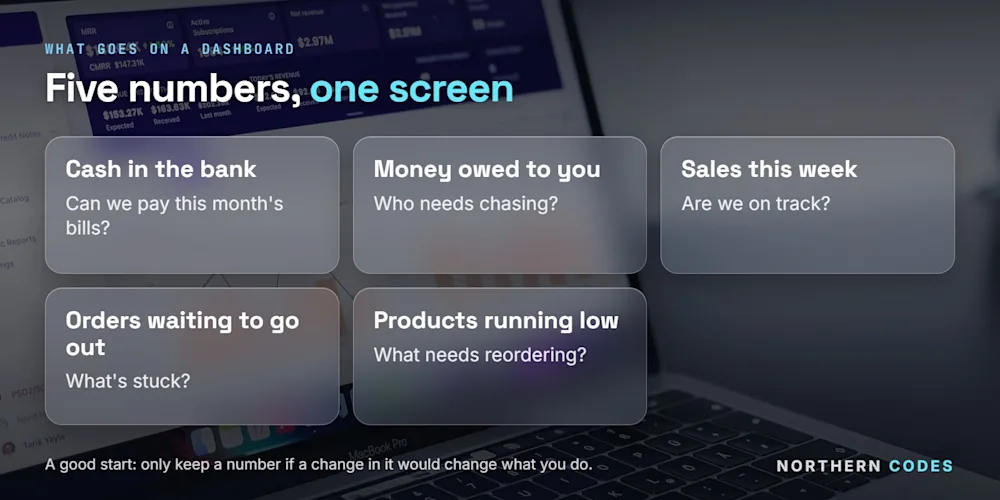
Only the numbers you'd act on. Five is a good start. If a number changes and you wouldn't do anything differently, leave it off. A dashboard with forty numbers on it turns into a report nobody reads.
Here are common ones, grouped by the part of the business they come from:
Part of the business | Numbers worth watching |
|---|---|
Money | Cash in the bank, money owed to you, money you owe, sales this week |
Sales | New orders today, quotes waiting for an answer |
Orders | Orders waiting to go out, orders sent late |
Stock | Products running low, stock that isn't moving |
Customers | Questions waiting for a reply, complaints this week |
Money owed to you is worth a place on almost every dashboard. UK law lets one business charge another interest on a late payment: 8% plus the Bank of England base rate (GOV.UK, checked 28-09-2026). You can only use that if you notice the payment is late.
What's the difference between a dashboard and a report?
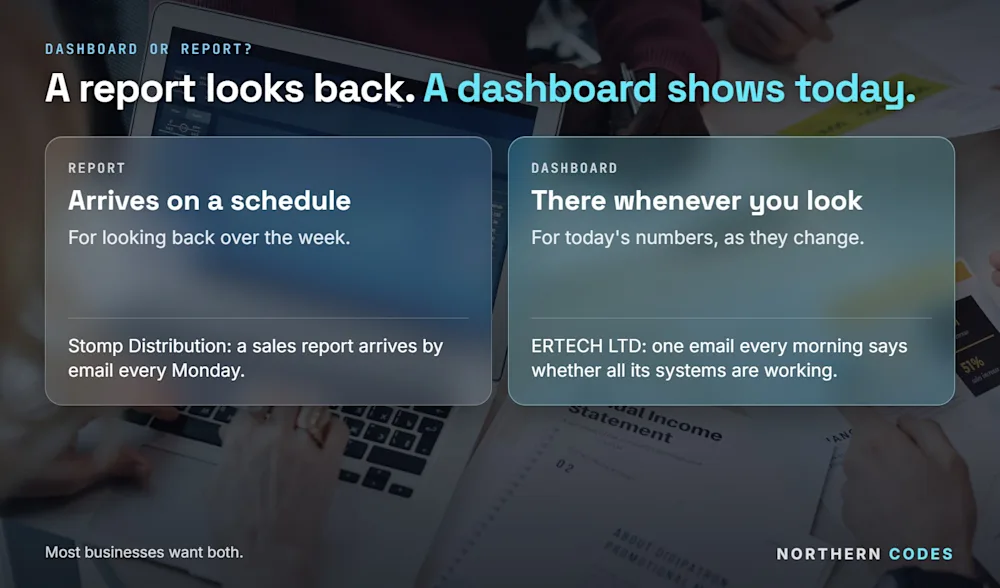
A report arrives on a schedule. A dashboard is there whenever you look. Both are useful, and a business usually wants both: the report for the weekly look back, the dashboard for today.
Two real examples. Stomp Distribution, which sells motorbikes and pit bikes, gets a sales report that makes itself and arrives by email every Monday. Nobody builds it.
ERTECH LTD, which sells security cameras, alarms and lighting to installers all over the UK, gets one email every morning that says whether all its systems are working. That's a dashboard that comes to you, so nobody has to remember to check.
Where do the numbers come from?
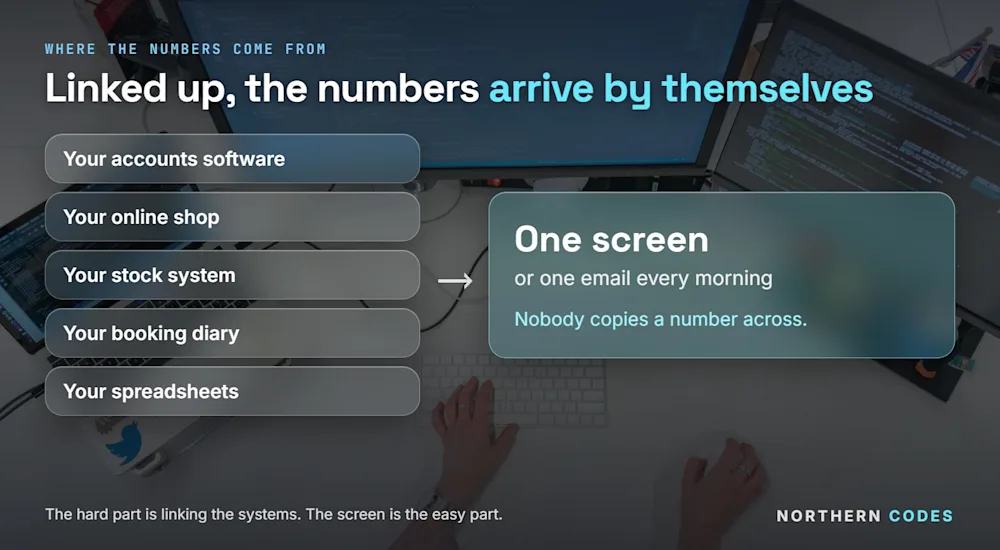
From the systems you already have: your accounts software, your online shop, your stock system, your booking diary and your spreadsheets. The hard part isn't the screen. It's getting those systems to hand their numbers over, every time, without someone copying them across.
That's why so many dashboards go stale. Someone builds a nice one in a spreadsheet, fills it in by hand for three weeks, then stops. The numbers drift, and people stop trusting them.
A dashboard only works when the numbers arrive by themselves. So the first job is linking the systems, so that a sale typed into your shop shows up in your numbers without anyone touching it. We've written more about getting your systems to talk to each other.
Do you need to buy dashboard software?
Usually not. Plenty of ready-made tools will draw a nice chart. None of them will fix numbers that live in five places and disagree with each other. That part is the real work, and it's the same whichever screen you use in the end.
Sometimes the right answer is a ready-made tool fed with linked-up numbers. Sometimes it's a simple screen built around exactly how you work. And sometimes it's one email every morning. We'll tell you which, in writing, before any work starts.
How much time does a dashboard give back?
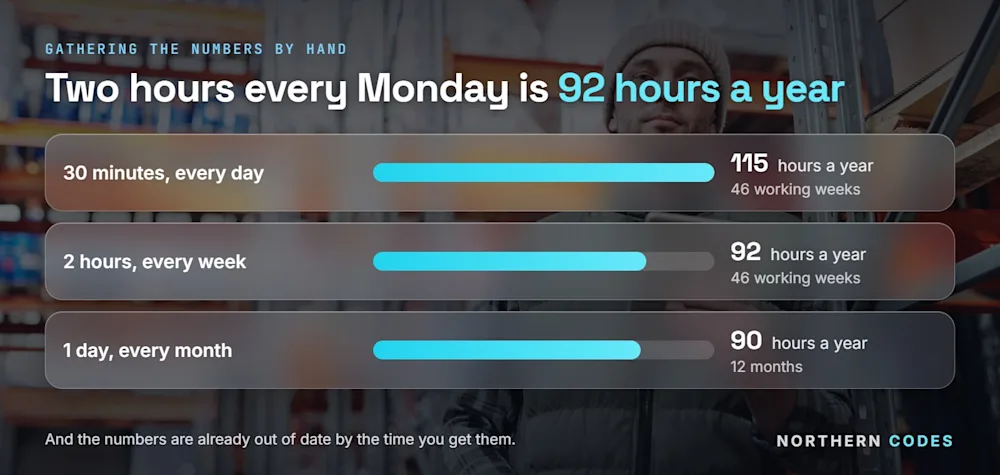
Count how long it takes today to answer your five questions. Then count how often you ask them. If gathering this week's numbers takes someone two hours every Monday, that's around 90 hours a year, and the numbers are still a week old when you get them.
Gathering the numbers takes | How often | Hours a year |
|---|---|---|
30 minutes | Every day | 115 |
2 hours | Every week | 92 |
1 day (7.5 hours) | Every month | 90 |
Daily and weekly figures use 46 working weeks; monthly uses 12 months. The time is only half of it. The bigger win is making decisions on today's numbers instead of last week's.
How do you start?
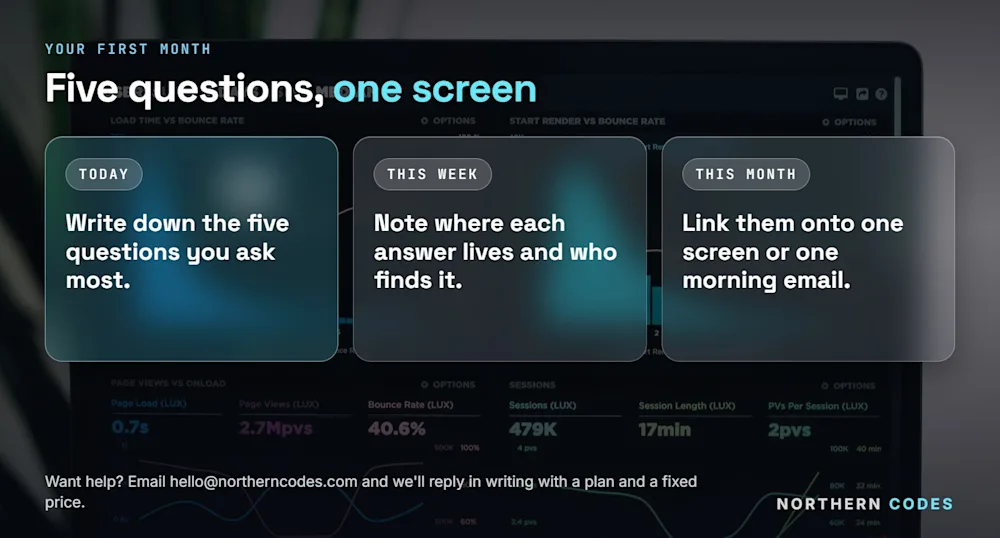
Three steps, over a month.
Today
Write down the five questions you ask most about your business. "How much cash do we have?" "Who owes us money?" "What's waiting to go out?" Keep it to five.
This week
Next to each question, write where the answer lives today and who has to find it for you. That list shows you which systems need linking.
This month
Get those numbers linked and onto one screen, or into one morning email. Then check that you look at it. If a number never changes what you do, swap it for one that does.
Tell us where the time goes
Tell us where the time goes. We'll reply in writing with a plan and a fixed price. A short form or an email is enough. Tell us here, email hello@northerncodes.com, or ask for a fixed price if you already know what you want.
Rather talk? Book a call.
If you're still working out what to hand over first, our guide to automating business processes walks through every job a computer can take on.
Common questions
Is a dashboard the same as a report?
No. A report arrives on a schedule, like a sales report every Monday. A dashboard is there whenever you open it. Most businesses end up with both.
Do I need to replace my systems to get a dashboard?
No. The numbers come from the systems you already have. The work is linking them so the numbers arrive by themselves.
How many numbers should a dashboard have?
Five is a good start. Only keep a number on it if a change in that number would change what you do.
Can the numbers update by themselves?
Yes. Once your systems are linked, the numbers update as the work happens: a new order, a payment landing, a product running low.
Can a dashboard come to me instead?
Yes. A morning email with your key numbers works well, because nobody has to remember to look. ERTECH LTD gets one every morning that says whether all its systems are working.
Will I know the price before you start?
Yes. You get a written plan and a fixed price before any work starts.
Sources: Office for National Statistics, Management practices and the adoption of technology and AI in UK firms, 2023 | GOV.UK, Charging interest on commercial debt. Both checked 28-09-2026.